1. Scorecard named "Subjects Scorecard" with a list if KPIs called "English" and "Computer Science".

2. Filter called "Choose Subjects"

Lets see how we can connect the filter to the scorecard.
1. As you may have already know, we need to create a dashboard page first.
2. Then add the filter and scorecard into the dashboard page
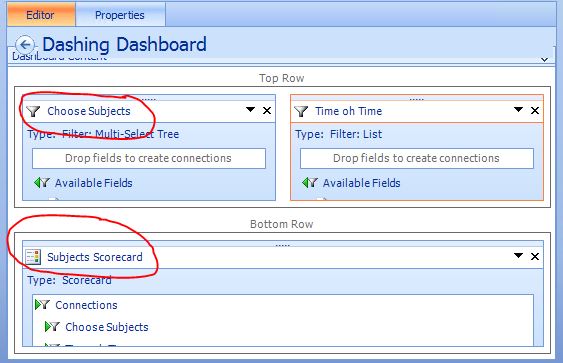
3. Next step is to create connection between them Click on the triangle arrow of the filter part and choose Create Connection.

4. You will be presented with the Connection window as below. On the Items tab, choose the scorecard name for Send values to

5. Then click on the Values tab. Choose the dropdown values as shown below. Click OK.

6. Save and Publish the dashboard.
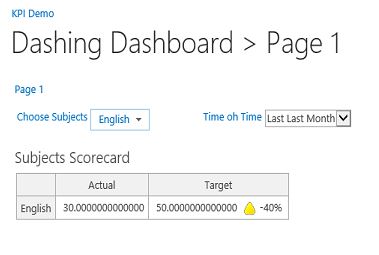
7. Access the dashboard. The dashboard with filter will look like below.

No comments:
Post a Comment